Assignments#
Week 06#
“Due date”: 12.06.2023
Exercise 01: xarray sel points#
Data:
Let me open this for you:
import rioxarray as rioxr
import geopandas as gpd
import numpy as np
import matplotlib.pyplot as plt
da = rioxr.open_rasterio('Copernicus_DSM_10_N46_00_E010_00_DEM.tif')
gdf = gpd.read_file('zip://HEF_RGI.zip!/HEF_RGI')
f, ax = plt.subplots();
da.plot(ax=ax);
gdf.plot(ax=ax, facecolor='C3', edgecolor='C3');
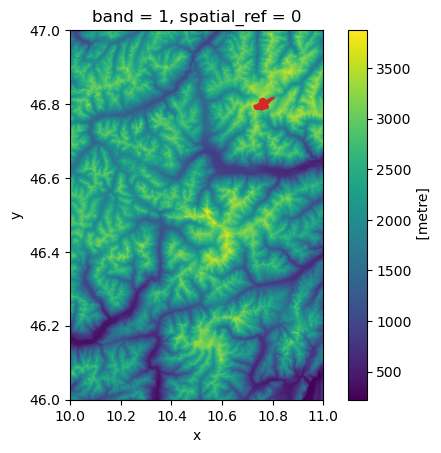
Good! Now:
extract the lons and lats coordinates of the glacier outline (this is a geopandas + shapely question)
use xarray interpolation to get the elevation of each vertice along the outlines
make a plot more or less looking like this.
The whole exercise is 4 lines of code. It’s all about reading the docs ;-)
# Your answer here
Exercise 02: medium data#
Please read the dask + xarray documentation page first.
I have downloaded ERA5 hourly precipitation data for you. You will find the files here: https://cluster.klima.uni-bremen.de/~fmaussion/teaching/climate/dask_exps/HiRes_Hourly_Surf
Your task is to compute the daily cycle (i.e. hourly average) over the entire year 2021. (shape: (24, nlat, nlon)).
You can do so by various means, but as a first step I recommend to:
open all 12 monthly files individually in a for loop
use dask to chunk the files before computing the daily cycle (not strictly necessary but you can try with and without it)
save the output in an intermediate netcdf file
open the intermediate netcdf files to average them (ideally weighting by month length)
If you are adventurous, try to do it without for loop, with open_mfdataset. I’ve tried quite a few things myself and discovered one of the main problems I was facing with open_mfdataset: one needs to specify the chunks at opening (i.e. open_mfdataset('', chunks=...) and not after (as I tried to do in class). I even opened a PR to improve the xarray docs in this respect. With this I almost managed to compute the daily cycle but it is still not working as efficiently as I’d like it to. Maybe it’ll work better for you?
Bonus: make a pretty gif out of it:
# Your answer here
Exercise 03: xarray accessors#
Your task is to code an accessor that adds something to xarray (I don’t mind what).
If you don’t know what to add, code an accessor that understands global data and plots climate maps when asked to (with ds.myaccessor.plot() on a single timestep array). Extending it could be to make multiple plots when there are more than one time step. As plot map background, use the typical global maps from the climate lecture.
Before you start coding right away, read this doc page: https://docs.xarray.dev/en/stable/internals/extending-xarray.html
While you are at it, read a little bit about the “composition over inheritance” principle as well (don’t overdo it - this page is not bad but quite advanced).
# Your answer here