
Today, a new paper was published in Nature Climate Change, titled “Peak glacier extinction in the mid-twenty-first century”. I am a co-author of the study, which was led by Lander Van Tricht, who carried out the vast majority of the work.
As a co-author, I stand behind the results presented in the paper. The study quantifies the number of inventorised glaciers that are projected to be lost under different climate scenarios, up to the year 2100. I believe these results are scientifically sound and important. At the same time, the way glacier numbers are framed in the paper’s title and in subsequent reporting requires particular care, because the concept itself is subtle and easily misunderstood.
Because glacier numbers are a complicated and often counter-intuitive topic, there is a real risk that the results could be misinterpreted by a non-expert audience if key assumptions are not made explicit. This blog post is therefore an attempt to clarify what the paper does and does not show, and to provide additional context that is difficult to convey in a short journal article or in media coverage.
This post reflects my own perspective and does not necessarily represent the views of my co-authors, although I believe most of the clarifications below are fully consistent with the paper itself. Many of these points are already discussed in the manuscript, but are unlikely to reach readers outside the scientific community.
TL;DR
The study counts the number of glaciers projected to be lost as inventoried in the Randolph Glacier Inventory version 6, the reference global glacier inventory published in 2017 (and now replaced by a newer version). This inventory does not include glaciers smaller than 0.01 km² and is known to be missing a very large number of glaciers (probably up to hundreds of thousands, depending on assumptions). Furthermore, the study does not account for glacier fragmentation, the process by which a single glacier splits into several smaller glaciers as it retreats to higher elevations.
While the study’s findings are correct to the best of my knowledge, they are only valid within these limitations and assumptions.
How do we count glaciers?
This is a topic far more complicated than this format would allow, but in a nutshell: scientists map glaciers from satellite imagery, often manually but with the help of automated algorithms. No single analyst has mapped all the glaciers in the world: the Randolph Glacier Inventory (RGI) is a compilation of glacier outlines produced by many different teams.
The RGI has a specific goal: to map glaciers as they existed around the year 2000, or as close as possible to that date. This choice matters, because satellite imagery at that time was coarser and less frequent than what is available today. As a result, the RGI is a heterogeneous collection of glacier outlines, mapped by different analysts, using different data sources and methods.
The RGI only includes glaciers larger than 0.01 km². This threshold was chosen long ago and has become a widely used community standard.
There are many complications in mapping and inventorying glaciers. The most important ones are:
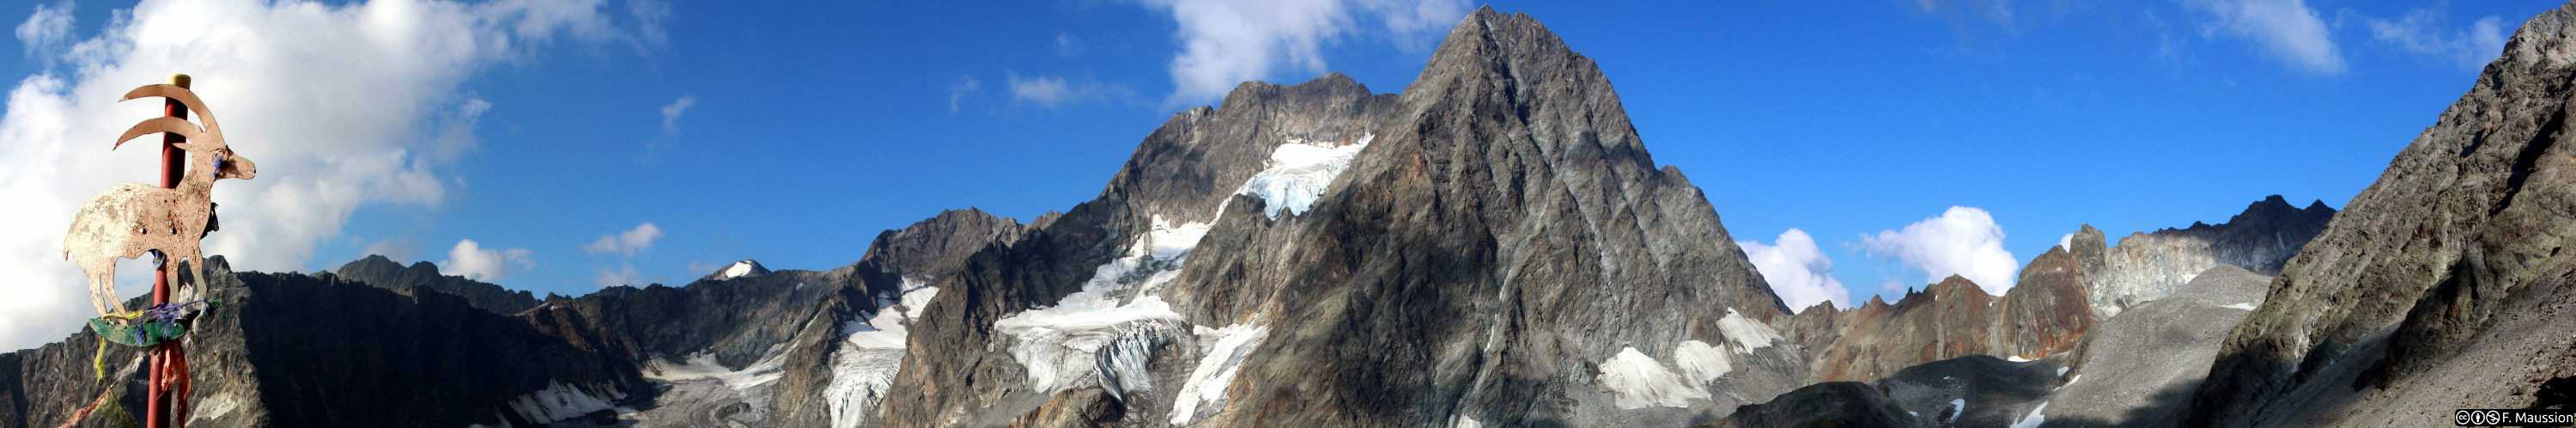
- What constitutes a “glacier” (or “more glaciers”) is often ambiguous. A quick look at the image banner at the top of this page would likely convince you: how many glaciers are visible in that image? “It depends”, I hear you say.
- Analysts sometimes miss glaciers. While it does happen that too many are counted (for example when snow patches are misclassified as glaciers), much more often glaciers are missed — especially the smaller ones. There is strong evidence for this (see explanation box below).
Why do we suspect that many glaciers are missing from global inventories?
There are several independent reasons to believe that a substantial number of glaciers are missing from existing global inventories such as the RGI. I present qualitative and quantitative arguments below.
- Resolution limits of older satellite imagery. Around the year 2000, many glacier outlines were mapped using imagery with spatial resolutions of 30 m or coarser. Small glaciers, glacierets, and steep ice bodies were therefore difficult or impossible to detect reliably.
- Regional re-inventories consistently find more glaciers. In regions where inventories have been updated using modern, high-resolution imagery, the total number of glaciers almost always increases, even when total glacier area decreases.
- Bias against small and fragmented ice bodies. Small glaciers are more likely to be debris-covered, shaded, or less visible, all of which makes them harder to identify consistently across regions.
- Practical constraints. Mapping glaciers is time-consuming and often relies on expert judgement. In remote or complex terrain, some ice bodies are inevitably missed. In regions with many large ice bodies, small glaciers are likely to be missed because deemed less relevant or covered by seasonal snow.
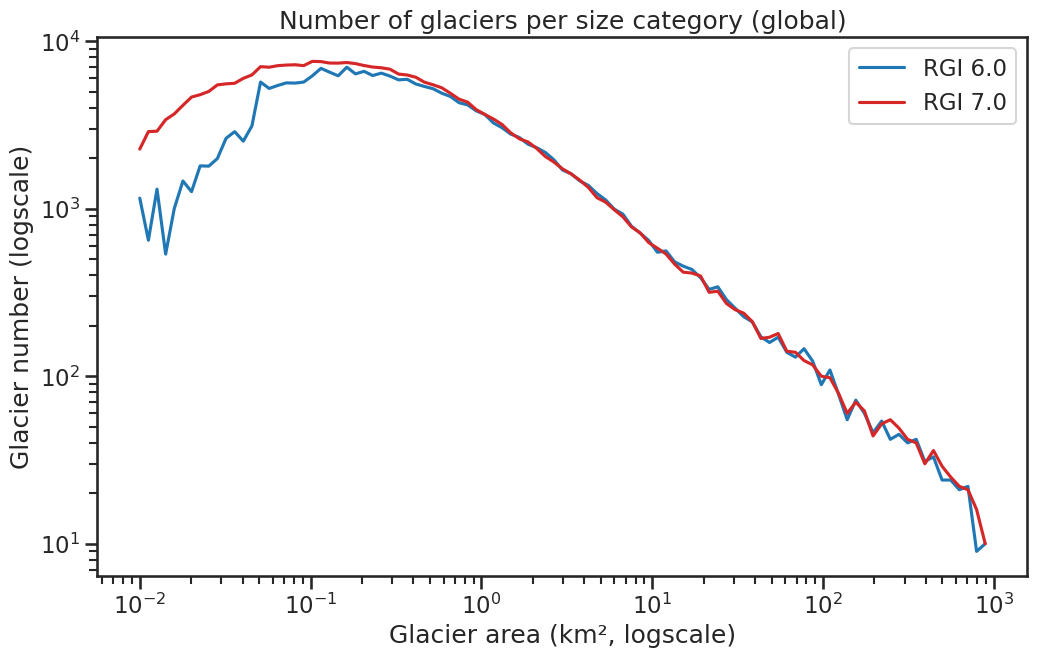
All of this makes intuitive sense, but there are also more quantitative indications that glaciers are missing from the RGI. The first paper to document this was the original RGI description paper (Pfeffer et al., 2014). In that study, the authors noted that glacier size distributions exhibit a distinct “dip” at small glacier sizes. Such a dip is not expected from theory: mathematical descriptions of glacier size distributions based on fractals and power laws predict a smooth scaling behaviour toward smaller sizes.
These findings are further supported by results from RGI 7, which represents a mapping improvement over RGI 6 in many regions. In particular, at least two indications suggest that RGI 6 is missing glaciers:
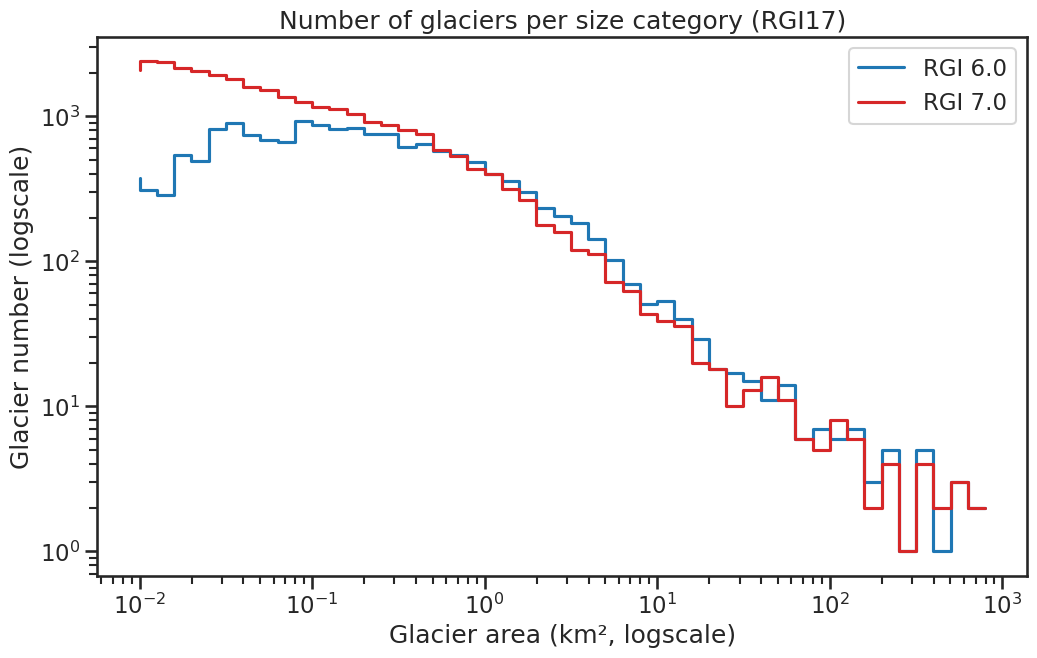
Source: RGI User Guide.
So, how many glaciers are there after all?
The short answer is: no one knows for sure, because of the limitations discussed above. Under reasonable assumptions, however, Pfeffer et al. (2014) estimate that there are roughly 435,000 to 462,000 glaciers worldwide (about twice as many as inventoried in Randolph Glacier Inventory version 6). RGI version 7 itself already counts around 60,000 more glaciers than RGI 6, largely as a result of improved mapping in several regions.
It is important to remember, however, that the number of glaciers is a highly arbitrary quantity, much more so than glacier area or volume, which are more clearly defined by physics and geography. As a result, the absolute number of glaciers rarely matters in itself, except in very specific contexts.
A good illustration of this ambiguity is the Hintereisferner glacier, shown below in an aerial photograph. Hintereisferner is a WGMS reference glacier, with systematic observations dating back to 1952. According to the “one glacier, one terminus” rule used in most inventories, its current outline in RGI version 6 (and 7) could arguably be interpreted as three separate glaciers. Yet it has remained a single glacier in successive inventories, because it used to be one continuous ice body when it was larger. This example illustrates well the inherently subjective nature of glacier numbers.

So, what does it mean to “count” glaciers that are lost?
Inventoried glaciers such as Hintereisferner have cultural, ecological, and societal value. Their disappearance is a powerful symbol of global warming, and documenting their loss matters. This is why initiatives such as the Global Glacier Casualty List and Goodbye Glaciers exist.
Our study published this week addresses an important gap by quantifying how our greenhouse gas emissions influence the future disappearance of glaciers as they are recorded today in the leading global glacier inventory. In that sense, it provides a clear and internally consistent answer to a well-defined question.
At the same time, the study cannot account for the loss of uncharted glaciers, nor can it meaningfully interpret glacier numbers beyond the subjective mapping choices embedded in the RGI. Processes such as glacier fragmentation are not considered: if a glacier like Hintereisferner splits into three or more separate ice bodies before disappearing entirely, the study still counts this as the loss of a single glacier. Likewise, regions that currently have many small glaciers mapped in detail will inevitably experience earlier and larger losses in terms of glacier numbers than regions where small glaciers are missing from the inventory.
Finally, when looking at mountain landscapes, and when assessing impacts on hydrology, ecosystems, or sea level, glacier area and volume matter far more than the subjective number of glacier entities one can count. All of these limitations and nuances are discussed in the paper itself, but they are unlikely to be picked up in headlines or short media summaries.
This is why interpreting results about “peak glacier extinction” requires care: the signal is real, but what is being counted (and what is not) matters just as much as the number itself.