
Atmospheric reanalysis products for the 20th century offer a promising alternative to station-based datasets like CRU. The most recent reanalysis project is the CERA-20C, a 10-member ensemble of atmosphere-ocean coupled climate reanalyses from ECMWF. It superseedes ERA-20C, which we quickly discarded from our list of candidates.
In this post, we assess CERA-20C temperature variability in the 20th century and compare it to the CRU TS v4.03 timeseries (which are currently used by default in OGGM).
Note 1: this is still a work in progress (WIP) and will be updated once we get answers to the questions asked below.
Note 2: if you are interested in the methodological details, jump to the last section of this post.
Maps: 2m temperature
Although CERA-20C is global, we interpolate it to the CRU TS dataset, which is available at 0.5° resolution on land only. We plot the average temperature for the reference period 1961-1990:
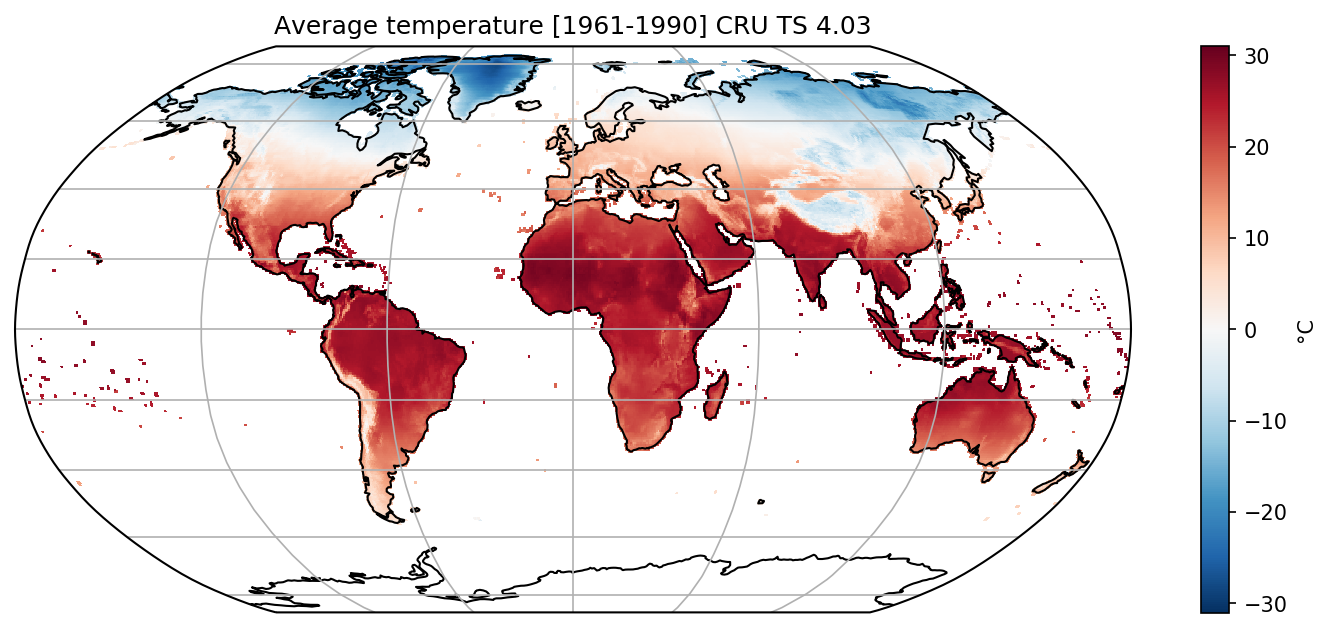
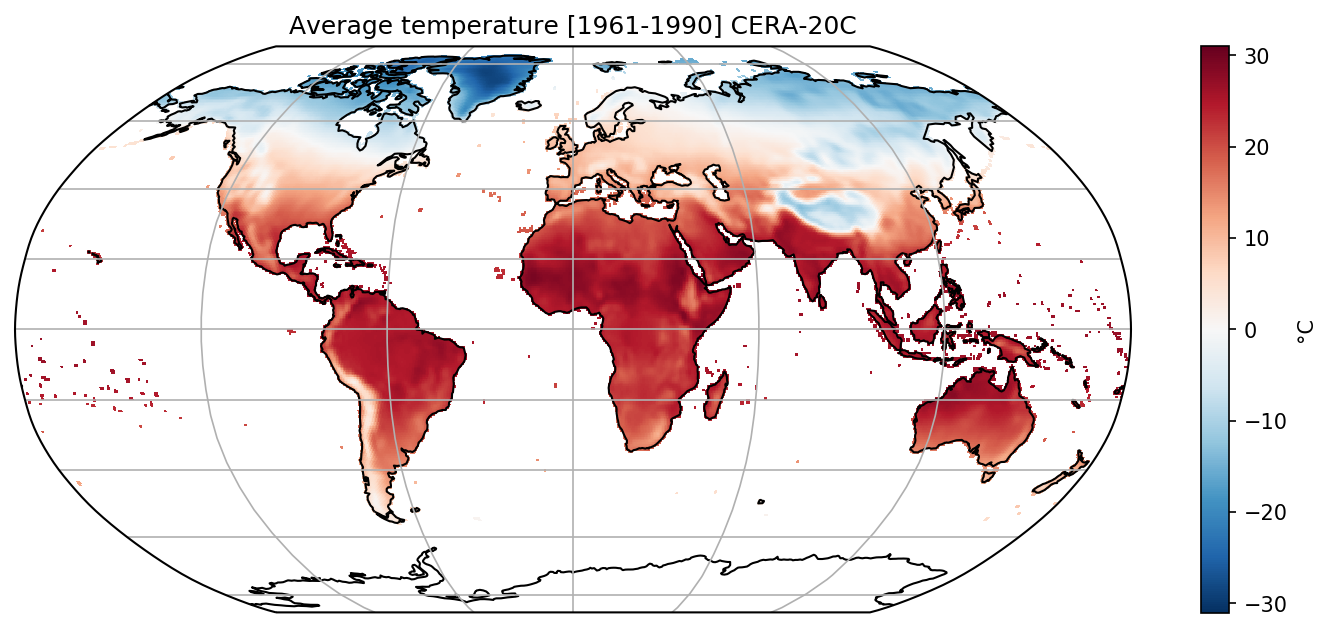 Click on the images to navigate and zoom
The two datasets are very similar, but if you look in detail of course there are strong regional differences. Here the difference between CRU and CERA over the same reference period:
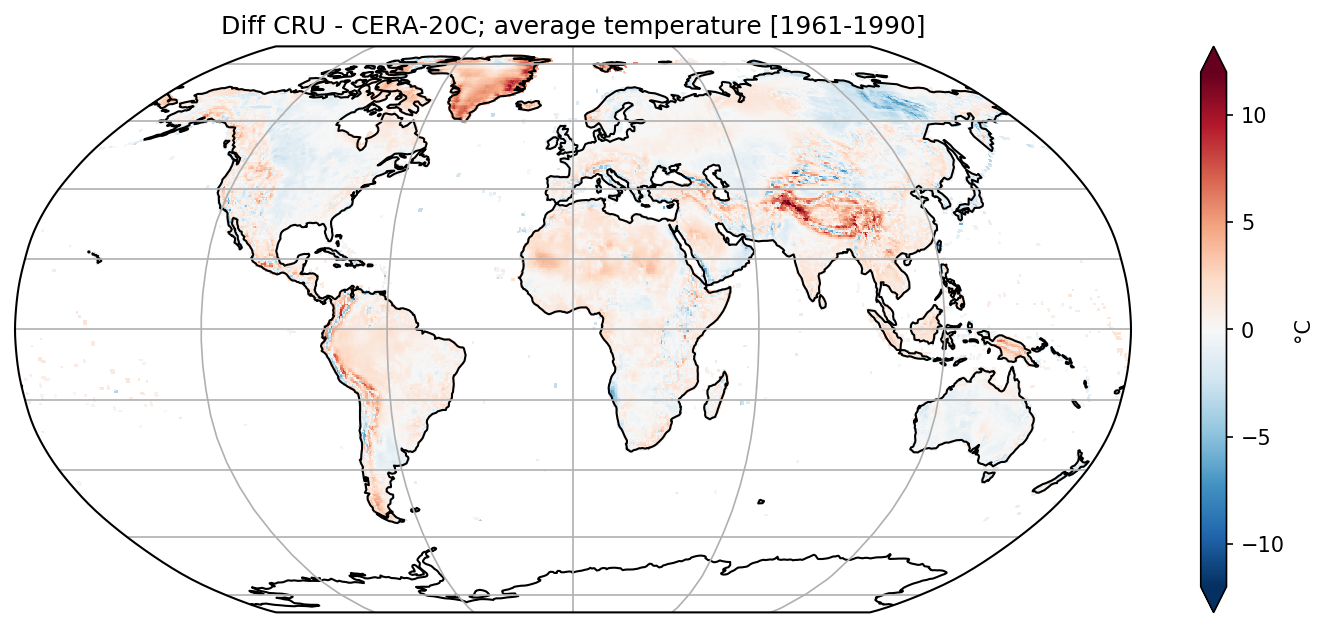
Some obvious discrepancies are due to topography: both datasets have different resolutions and reference topography. Therefore (and for other reasons specific to OGGM), we now simply assess the temperature changes, defined as anomaly from the 1961-1990 reference period.
20th century temperature changes
Over land
Let’s have a look at the global land average first:
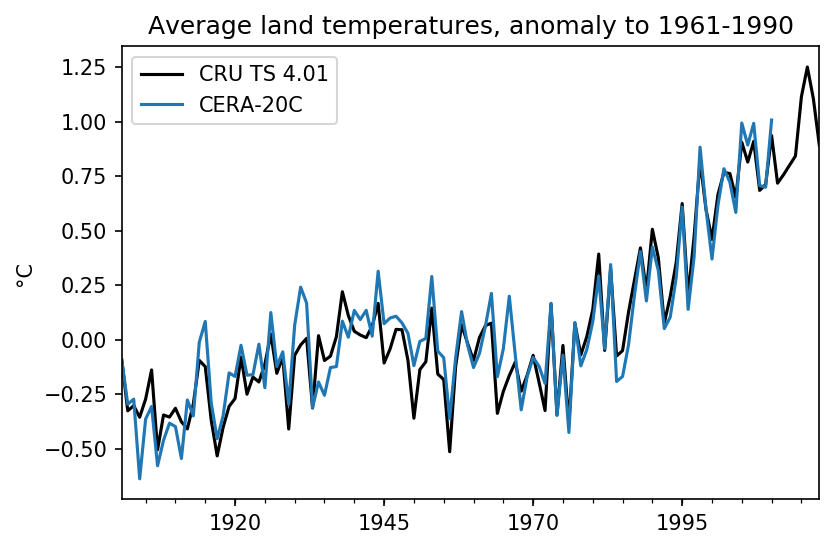
The two datasets agree quite well, in particular from 1970 onwards. The largest discrepancies occur in the first half of the century. This agreement is impressive, given that CERA-20C does not assimilate any temperature observation from land, only sea surface temperature!
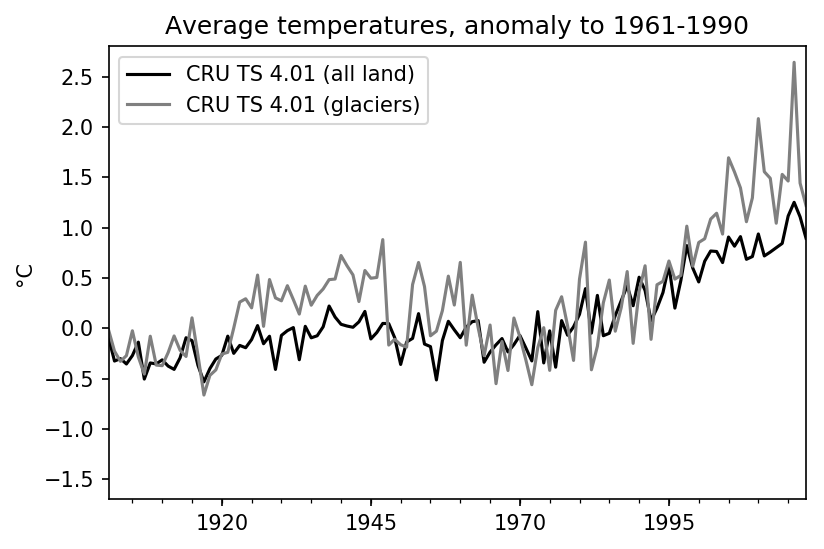
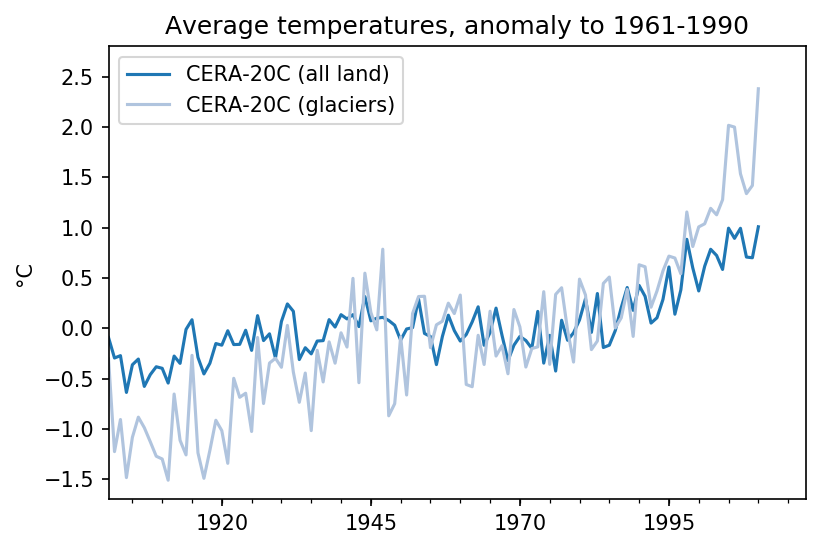
Over glaciated areas
With OGGM, we are interested in temperature variability over glaciers in particular. Let’s average both datasets over glaciated areas only, effectively giving much more weight to arctic regions:
With this weighted average, the picture is more nuanced and the two datasets agree much less:
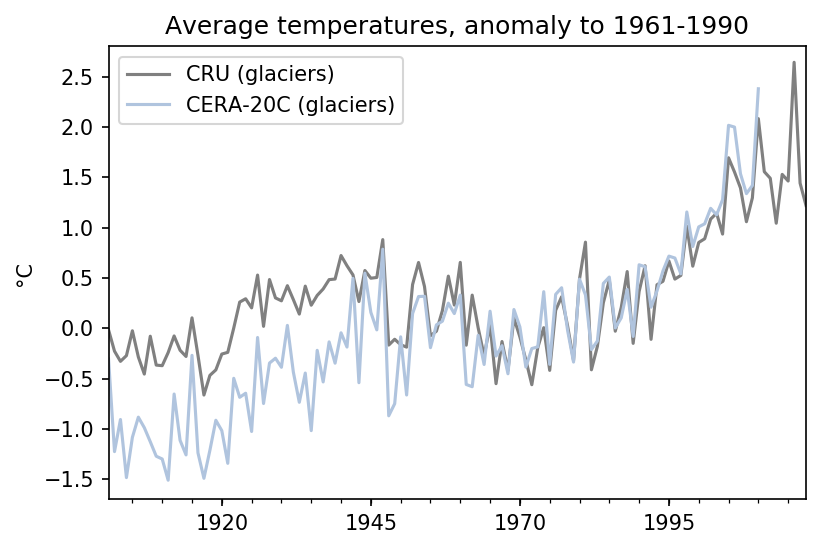
Most differences happen before the 1950s. In particular, CRU displays a very warm period from the 20s to the 50s over glaciers, well above (0.5°C) the 1961-1990 average. This is not the case for CERA-20C, which is much cooler.
What could be the reason for these discrepancies?
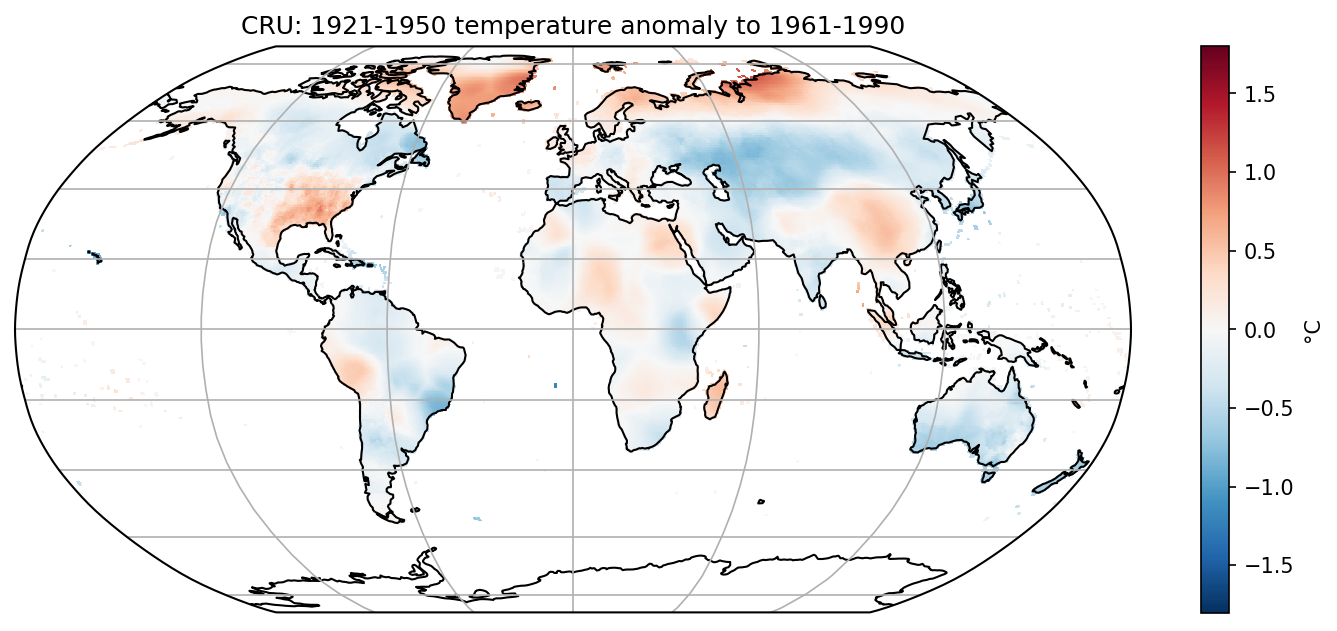
A closer look at the 1921-1950 period
Let’s have a look at theses differences from a regional perspective, displaying the [1921-1950] anomaly with respect to [1961-1990] on a map.
CRU:
 CERA-20C:
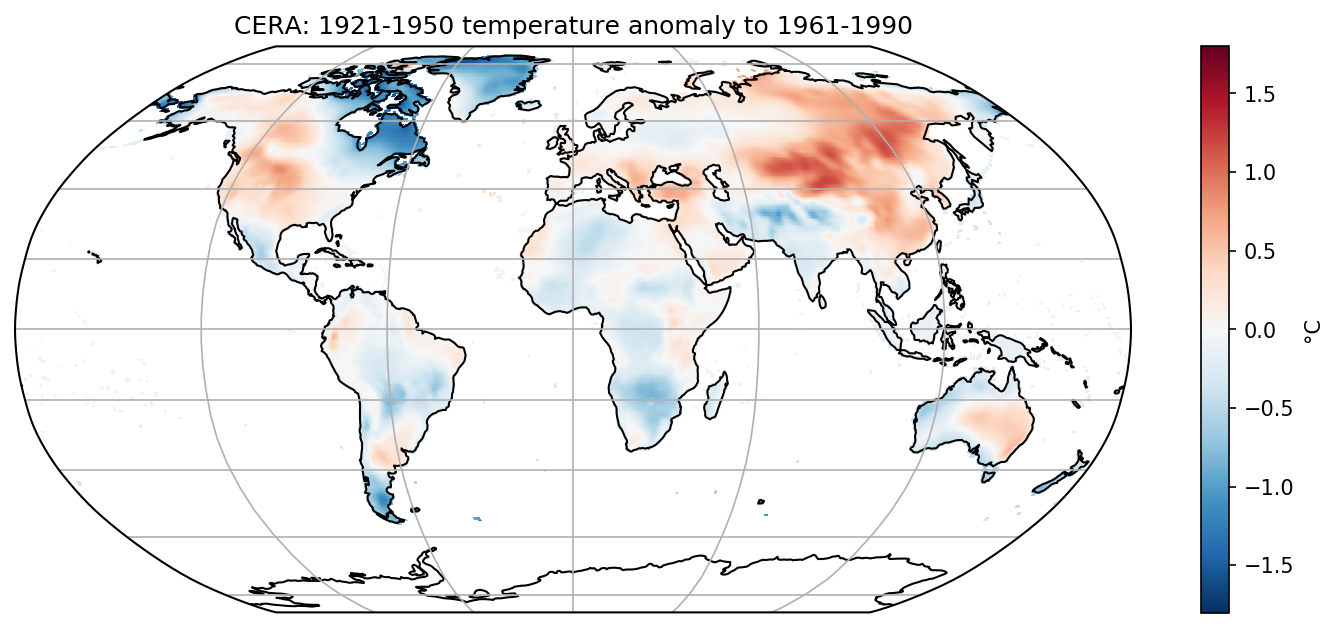
The two maps are quite different! Although they agree on the global average CRU and CERA-20C display very different spatial patterns of the anomalies. Most notably: CRU is warmer in the Arctic in general and south-east Greenland in particular, cooler over large parts of Central Asia. CERA-20C is much cooler in Greenland and the Canadian Arctic, warmer over Central Asia. Both regional patterns explain the strong discrepancies in the first half of the 20th century.
Discussion and open questions
Since CRU is based on observations of temperature, the confidence in CRU data is much higher over land than CERA-20C. Furthermore, there is some evidence (see e.g here and here) of strong warming in south-eastern Greenland in the 20s, further decreasing our confidence in CERA-20c. Finally, CERA-20C has known issues with accumulating Arctic sea-ice, which could explain both the colder Greenland in recent times and the spurious 20th century trend.
That being said, CRU also had very few available data at northern latitudes before the 50s (see plot below), and their reconstruction (especially in the Arctic) is also to take with great caution. I tend to have great confidence in “physically based interpolations”, which is kind of what the CERA-20C is. I’m truly impressed by this dataset, and by its capacity to reproduce the global 20th temperature variability from such little data (SST, mean SLP, and winds).
Questions:
- can CERA-20C be used for temperature reconstructions at all? The dataset is very new and I couldn’t find any literature about that (yet).
- what can explain the strong regional discrepancies in the 20s, but still a good agreement on the global average?
- assuming that the strong warming in the 20s to 50s in south-eastern Greenland is “real”, how widespread was this warming?
Let’s see if the academic internet has some answer to these questions.
Data and methods
The WIP code can be found here. Data and methods, in short:
- CERA-20c is available on a global 1° grid, 1901-2010
- CRU TS 4.03 is available on a 0.5° grid, for land surface only, without Antarctica, 1901-2018
- We use the ensemble average of CERA-20c here, and do not look at each ensemble member individually. There are differences between them, but not of that magnitude.
- we use the CRU grid as reference and bilinearly interpolate CERA-20c into it
- when computing the global average, we average for land surface only (where CRU data is available), and we do correct for spherical earth (area weighted average)
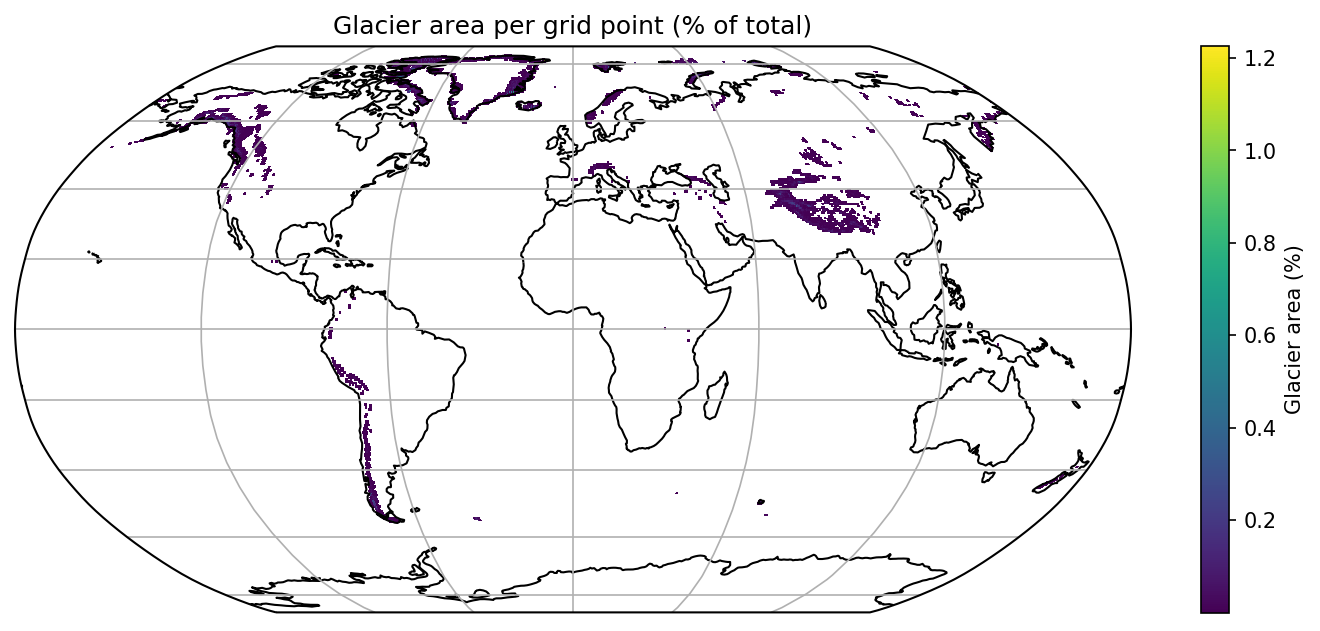
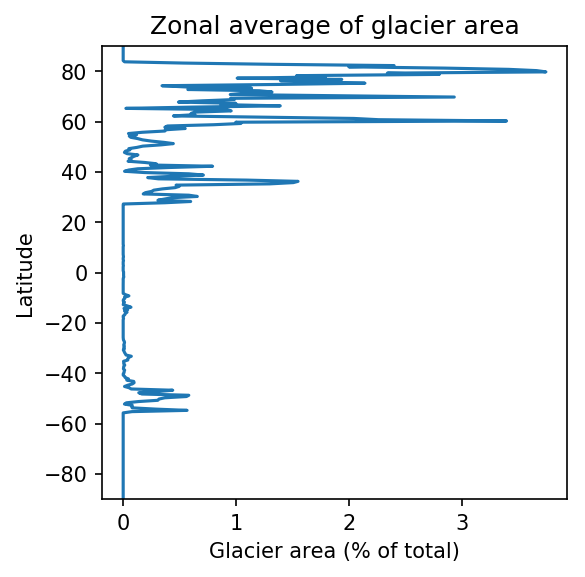
- when computing the global glacier average, we average for glaciated areas weighted for the total glacier area per grid point (effectively giving much more weight to the Arctic and High Mountain Asia regions).
- glaciated areas are obtained from the RGI version 6.
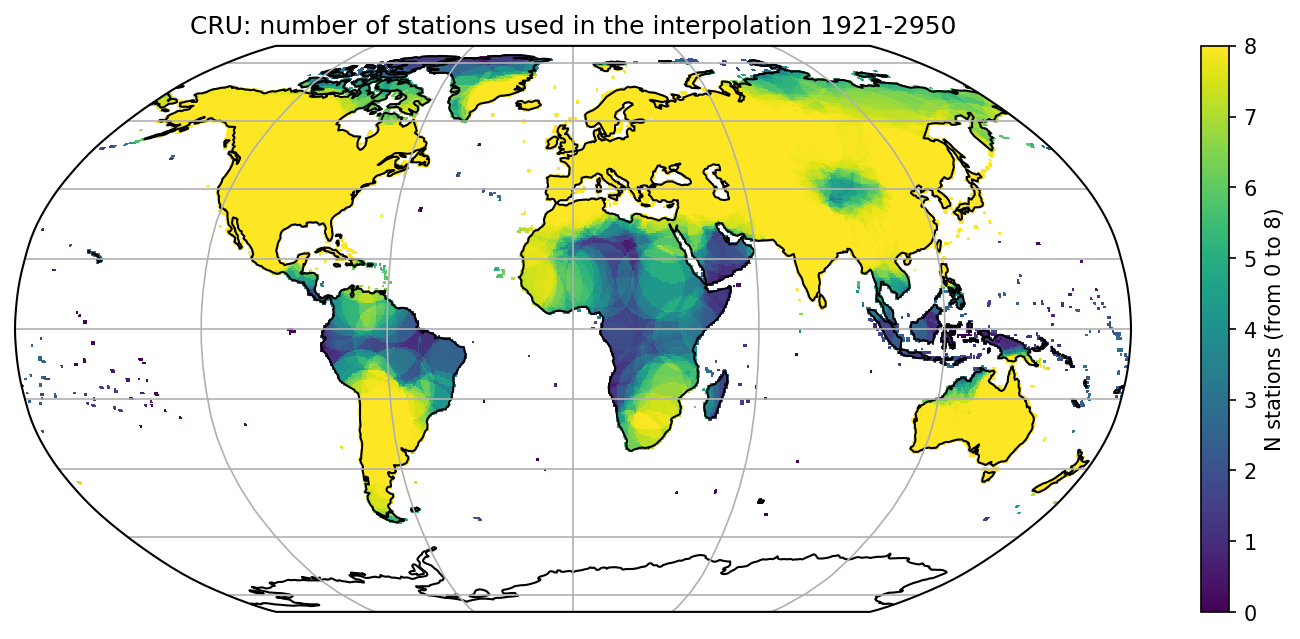
Number of stations used for interpolation by CRU in the first half of the 20th century